The 7- and 14-day averages of coronavirus cases in Wisconsin show the curve may be starting to "bend" in the wrong way.
It's been one week since the Wisconsin State Supreme Court rendered its verdict on Gov. Tony Evers's "Safer-at-Home" order, effectively "opening up" the state and ending social distancing rules for businesses and other organizations, save for a few pockets of locations that issued more localized orders.Undoubtedly, because of the court's actions (and the inability of Republicans to consider any cautionary action proposed by the governor), coronavirus will likely spread across the state more than it has in recent weeks. Safer-at-Home was working — and in the weeks to come, it may become painfully obvious just how good it was doing so.

When the order was given, a number of businesses across the state (notably, bars) opened their doors right away. Images from these happenings detail just how well people are respecting social distancing rules on their own — in that, they're not at all, in many cases.
And in some instances, people are reporting being harassed for even daring to wear a mask in public. Other places45 minutes after the bars open in Wisconsin.... pic.twitter.com/xqaDlS6ajP— Nick's bar (@nicksonsec) May 14, 2020
It's only been a week, however, and trying to observe changes between May 13 and May 20 could prove difficult. COVID-19's incubation period is sometimes as little as 4 to 5 days, but can last as many as 14 days long. In short, we shouldn't be surprised if the first week out from the Supreme Court ruling doesn't showcase a huge outbreak across the state. It will likely take two or three weeks from that date before we start noticing bad trending numbers.
Yet what we do see as of Wednesday, May 20, isn't great.
Across the state on Wednesday, 8 percent of tests came back positive for coronavirus. That's not the highest it's ever been, but it's the second time in five days that the rate has been above 8 percent.
The last time the rate was above 8 percent twice within five days was nearly two weeks ago, as the state had been winding down in cases of COVID-19.
Looking at a singular day, however, doesn't always give you the whole picture or an accurate portrayal of what's happening — it's better sometimes to take a look at each day's 7- or 14-day average. The news on that front, too, is not so great.
The 7-day average of coronavirus tests coming back positive saw a steady decrease from a high of 10.2 percent starting on May 5. We reached a low across the state of 5.74 percent on Saturday, May 18. But the 7-day average of positive tests is starting to tick up — as of Wednesday, it was up to 6.17 percent.

That's not a significant change, and it could mean nothing. Let's hope that's the case.
The 14-day average of coronavirus tests coming back positive looks a bit better, but also comes with one important warning. Like the 7-day average, the 14-day average has been steadily decreasing since the start of this month.
But today, with the new numbers out, something strange happened. For the first time in two weeks, the 14-day average of coronavirus tests coming back positive across the state didn't decrease.
It didn't increase, either, and that's the silver lining: it stayed put from day-to-day. But even that is a warning sign, that if Wisconsinites don't start taking this thing seriously, the numbers are going to start going back up, just like they did in the 7-day average.

I'm planning to keep an eye on where things change county-by-county here on out, too — and I'm made a color-coded rating system to keep track of how things have changed within each county compared to when the State Supreme Court issued its opinion.
Green counties are areas where not much has changed at all. Light green counties are where there's been a significant percentage change in coronavirus cases, but the reason behind it is due to having a small number of cases to begin with (Lincoln County saw a 200 percent change in cases from last week to this week, for instance, but that's a change of 1 case to 3 cases there).


Yellow counties are areas where there's been a significant change from May 13 — an increase of 5 percent to 9.99 percent in terms of coronavirus cases (they also differ from "light green" counties in that there are more than 10 new cases being identified week-to-week).

Red counties are where there's even more change going on — an increase of 10 percent or more coronavirus cases in the county, with more than 20 additional cases identified versus May 13.
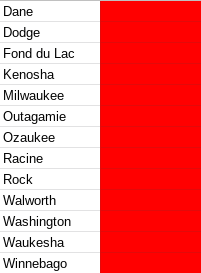
Listed below are a few counties worth watching over the next few weeks, their current coronavirus cumulative totals, and the percent-change from May 13 to May 20.

One other quick note: I've been keeping track of changes happening in Waukesha County, specifically, since they started having protests in Brookfield, keeping an eye on how things changed in that county overall compared to an area where most residents are trying to respect social distancing, like in Dane County.
I noted on May 9 that there was already a gap between the per capita rates of Dane County and Waukesha County, in terms of cumulative coronavirus cases each county had, with Waukesha having 9.45 percent more cases than Dane County.
I want to keep up with those observations, as Dane County continues to respect Safer-at-Home rules on its own, and Waukesha County was among the most ardent against them from the start.
As of today, that gap has widened significantly. In fact, Waukesha County, on a per capita basis, has 22.8 percent more cumulative coronavirus cases than does Dane County. Additionally, it's per capita death rate from COVID-19 is also 25 percent higher than Dane's.
The evidence seems to point to social distancing, and the plan started by Evers, having worked. I'm hoping that reopening the state won't lead to more cases, won't lead to more deaths from coronavirus, in the state.
But science and statistics seem to imply we're about to see things go in a direction we'd rather not have them go.
UPDATE: In my haste to get this article published, I forgot to include a link to the data itself. You can view that data, available via Google Drive, at this link.